Settling a traffic dispute
The figure comes from the customer's own switch port, and every gap in measurement is recorded rather than filled in. The number on the invoice is one you can stand behind.
For datacenters and dedicated and colocation hosting providers
DCManage reads each customer's usage from switch counters, applies their quota and extra traffic, and blocks or unblocks their port on overage or an unpaid invoice. Power, console and hardware health for every server sit beside it, and WHMCS stays in step in both directions.
Live demo A live demonstration with invented data, rebuilt every night. The sign-ins are printed on each sign-in page.
Every screen on this page is the running product, captured from the application itself.
The figure comes from the customer's own switch port, and every gap in measurement is recorded rather than filled in. The number on the invoice is one you can stand behind.
When a customer goes over quota or leaves an invoice unpaid, the port is blocked after the grace period you set and an AI review, and unblocked automatically once they buy traffic or pay.
Power, HTML5 console, virtual media and hardware health over iLO, iDRAC, IPMI or Redfish, all on the server's own page, even when the management network is reachable only through WireGuard or a SOCKS proxy.
Everything a dedicated or colocation provider handles between the network and the bill, on a server you control.
64-bit SNMP counters are read straight from the switch on the interval you choose, rolled up every five minutes, hourly and daily, with the 95th percentile and a download, upload or total billing basis.
Base quotas, purchased or granted extra traffic, and a grace period. On overage or an unpaid invoice the customer's port is blocked after an AI review, and unblocked as soon as the reason clears.
A WHMCS module keeps the two systems in step, and in the customer portal each customer sees their own services and usage.
Cisco IOS and NX-OS over SSH, Telnet or SNMP: port lock, Extra-Permit access lists and object groups, MAC lookup and port discovery.
iLO, iDRAC, IPMI and Redfish: power, HTML5 console, virtual media, and inventory and health for memory, drives, RAID, fans, power supplies and event logs.
Sites, racks and a rack-unit elevation that shows exactly what is mounted where, passive equipment included.
Read PRTG, Zabbix, Cacti or LibreNMS beside DCManage's own measurement and compare the figures port by port before you rely on either.
Roles with fine-grained permissions, two-factor sign-in, encrypted credentials, signed updates and an audit log nobody can edit. Management networks are reached over a WireGuard tunnel or SOCKS proxies.
A complete right-to-left interface with Solar Hijri dates, built that way from the start rather than mirrored from English. Your team and your customers each work in their own language.
Captured from the running application with demonstration data: the same pages you install.
Open a site and its racks are there; open a rack and every unit is drawn, including the passive equipment nobody usually records.
Datacenters and racks Sites, the racks in them, and an elevation that reports a double-booked unit rather than overlapping it silently.
Inside a datacenter One site, its racks, and how full each of them is.
A rack elevation Every unit drawn, switches and passive equipment alike, with a double-booked unit reported rather than overlapped.
Open a switch for its ports, health and hardware usage; open a port for what it carried, whether it is locked, and which machine is behind it.
Switches Inventory across sites, with what each device is collecting and when it last answered.
Inside a switch Its ports, what each is doing, its CPU, memory and uptime, and its forwarding-table and hardware usage.
Inside a port What it carried over any window, its lock state, and the machine and customer behind it.
Where each one is racked, the ports it is reached through, its management controller and the proxy that reaches it.
Servers Every machine, where it is racked, the port it is reached through, and its management controller.
Inside a machine Its rack position, the ports it is patched into, its management controller and the proxy that reaches it.
A service against its allowance, on the basis it is billed on, with the ports its usage is measured from.
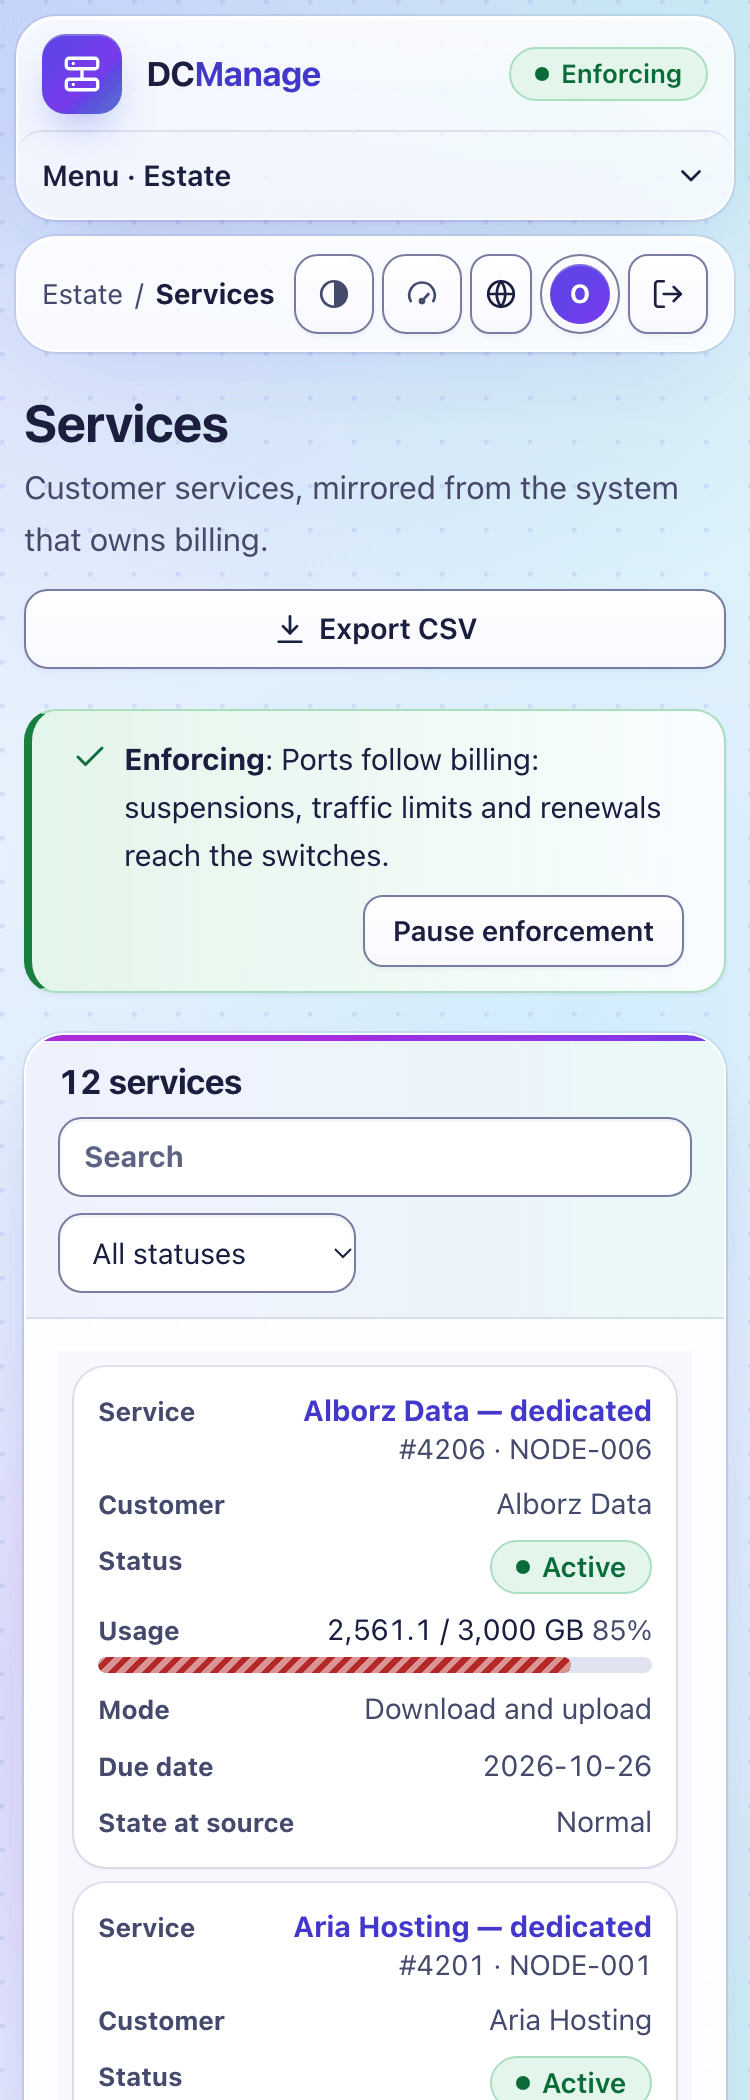
Services and usage Each customer against their allowance, on the basis they are billed on. Over-quota is marked rather than merely coloured.
Inside a service Allowance, additional traffic, carried debt, and the ports the usage is actually measured on.
Its own collector, any external monitoring beside it, and the proxies that reach a network this machine has no route to.
Monitoring Where every figure comes from, stated before the figure. The local collector and any external source are shown separately, because they fail differently and only one of them is yours to fix.
Monitoring sources External systems read alongside the platform's own collector, with how many of their sensors point at a port we also measure.
Proxies How the platform reaches a network it is not on, and what is reached through each one.
Who may do what, what they did, what runs on a schedule, which addresses may connect, and programmatic access.
Roles Permissions grouped by consequence, with the risky ones marked as such.
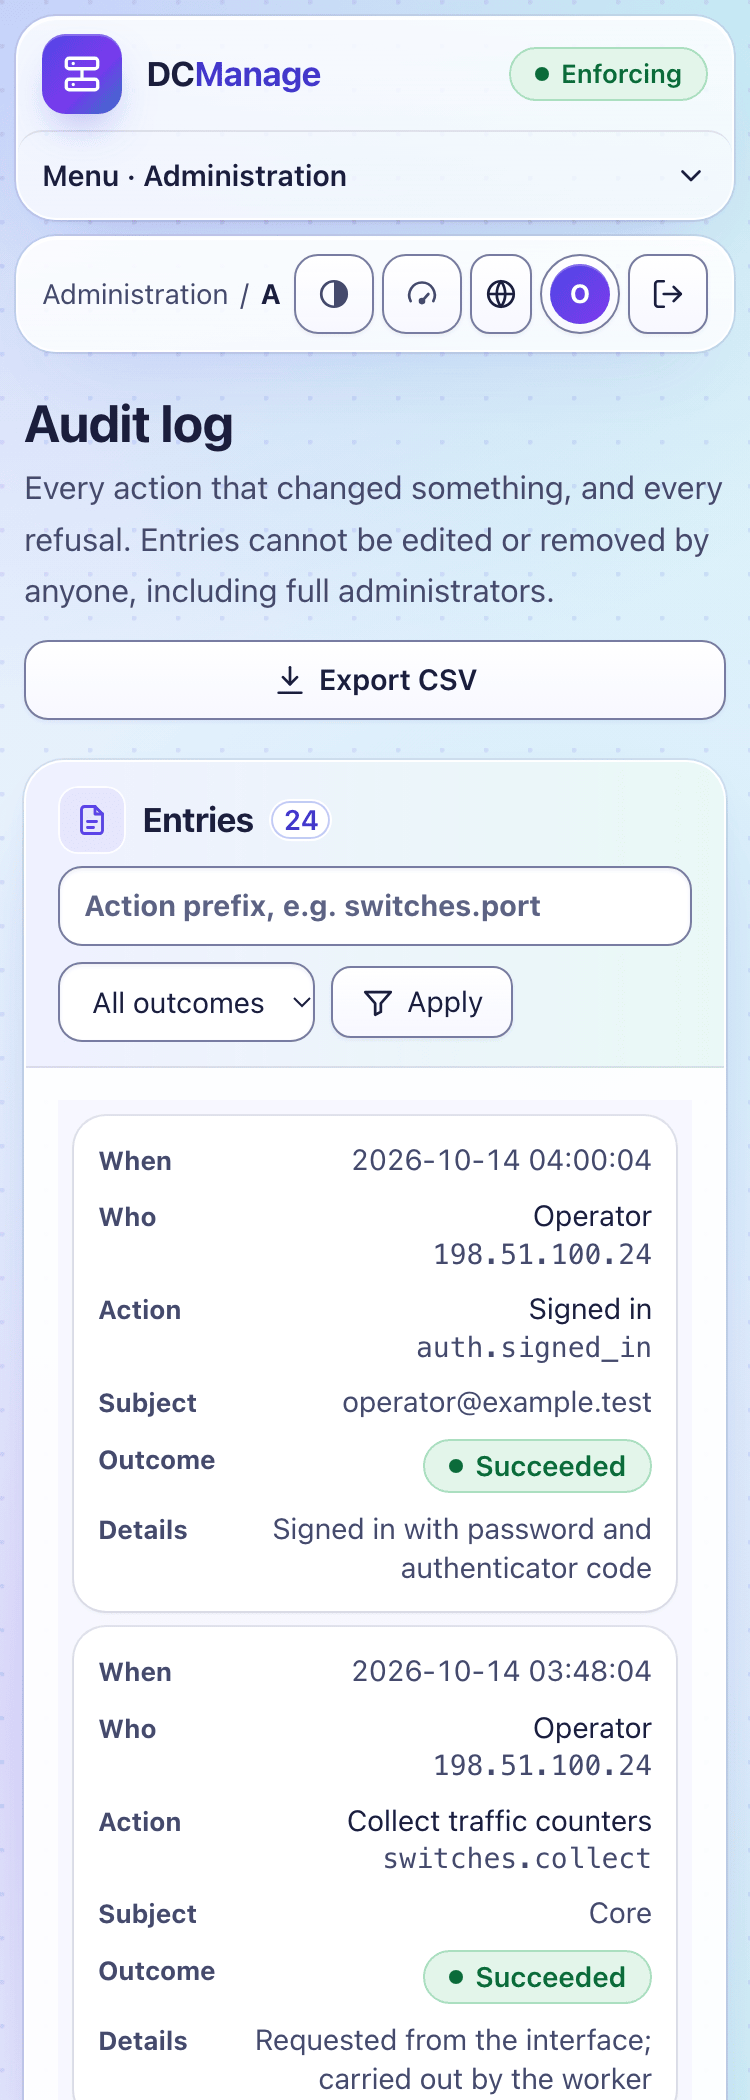
Audit log Readable statuses over the stored key, so the row can still be filtered on exactly what was recorded.
Scheduler What runs, when it last ran, and how long it took — so a task that quietly stopped is visible rather than inferred.
Security Which addresses may reach the panel at all, enforced before the sign-in form is ever drawn.
API keys Keys with their own permissions, restricted to source addresses, with the secret shown once.
Nothing is installed on customer machines. Everything is read from your network equipment and stays on your server.
Install DCManage on your own server, connect WHMCS, and bring in sites, racks, switches, servers and services with their source identifiers kept.
The collector reads switch counters on the interval you set. Usage is attributed to the customer behind each port, and reconciled with your existing monitoring if you have one.
Switch enforcement on once the figures agree. From then on quotas, grace periods, the AI review and block or unblock run by themselves, and every decision is in the audit log.
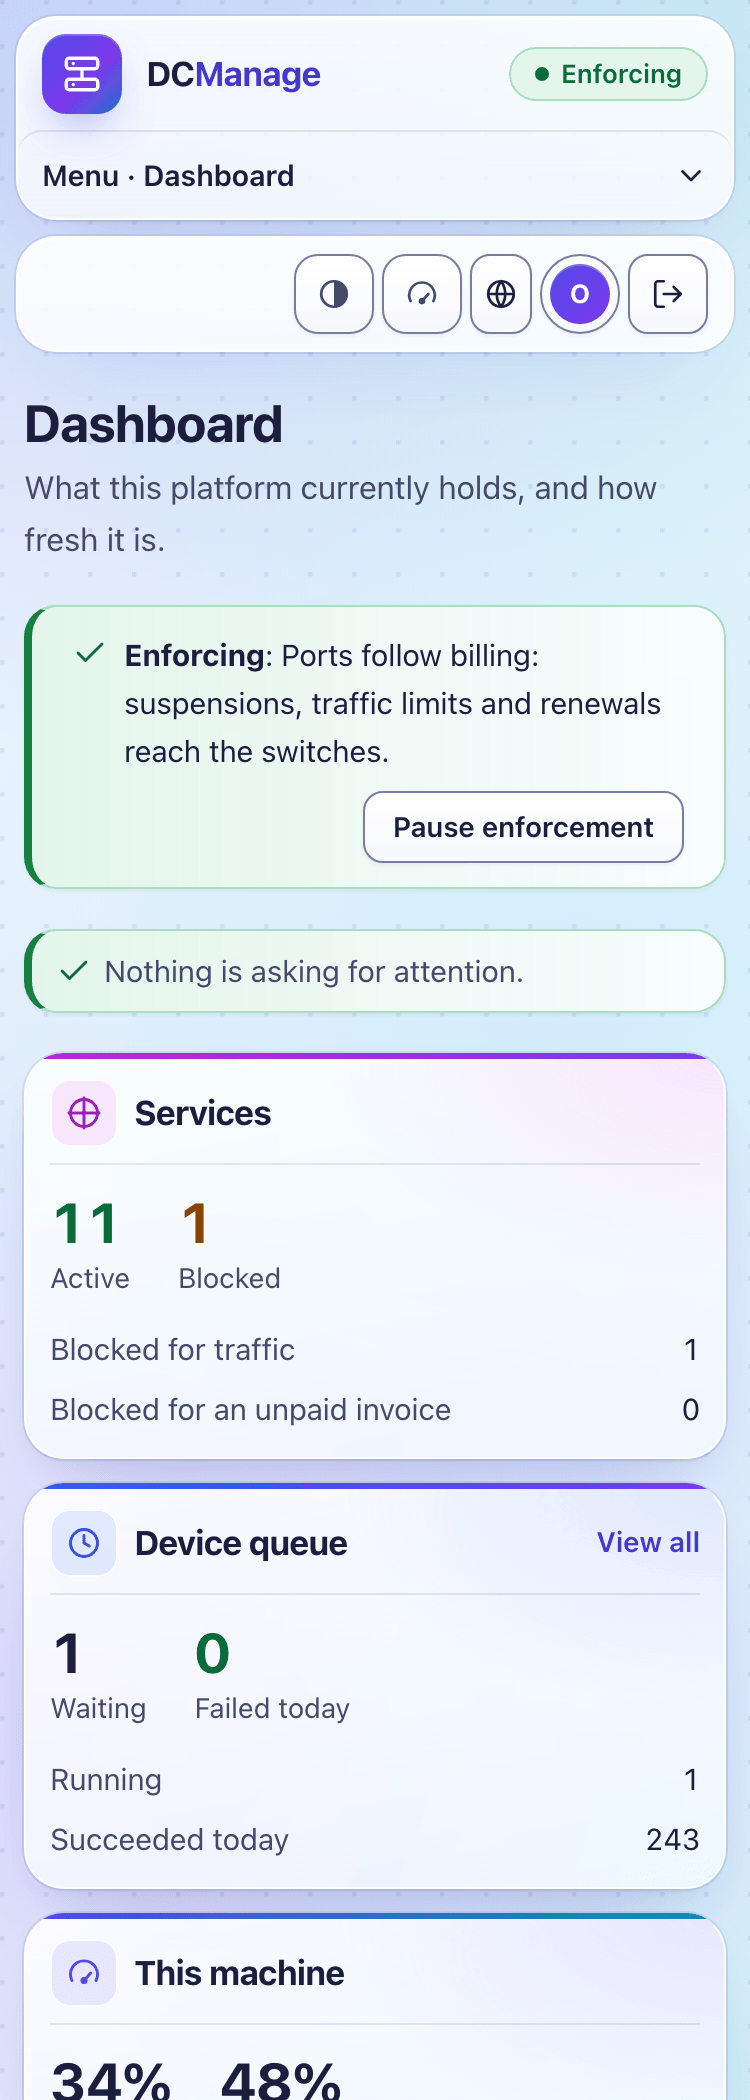
On a phone, tables turn into cards that keep their column names, so a midnight check from the datacenter floor still says what every number means.
Only once you switch enforcement on; it ships switched off. When it is on, every block waits for the grace period you set and an AI review, and it is lifted automatically when the customer pays or buys more traffic. Arming it takes a full administrator and a typed confirmation.
No. DCManage does not issue invoices. Its WHMCS module connects the two in both directions: services come from WHMCS, and an unpaid invoice there can block a port here.
No. DCManage runs on your server, and the panel loads no external asset: no font service, no CDN, no analytics. It is built for networks whose firewall lets nothing else through.
No. Add it as a source and both run side by side on the same ports, so you can compare them over a full billing cycle before relying on either. Cacti and LibreNMS work the same way.
Complete. Every screen, message and date works in Persian, right to left, with Solar Hijri dates, and a missing translation stops the build. Your customers get the portal in both languages too.
In your own PostgreSQL database. Credentials are encrypted, and the audit log cannot be edited or deleted even through the database account the application itself uses.
Open the live demo with invented data, or tell us about your datacenter and we will reply with a quote.